Plot model loss over epochs
Usage
# S3 method for class 'brulee_mlp'
autoplot(object, ...)

# S3 method for class 'brulee_logistic_reg'
autoplot(object, ...)

# S3 method for class 'brulee_multinomial_reg'
autoplot(object, ...)

# S3 method for class 'brulee_linear_reg'
autoplot(object, ...)

# S3 method for class 'brulee_resnet'
autoplot(object, ...)

# S3 method for class 'brulee_auto_int'
autoplot(object, ...)

# S3 method for class 'brulee_saint'
autoplot(object, ...)

# S3 method for class 'brulee_rln'
autoplot(object, ...)Details
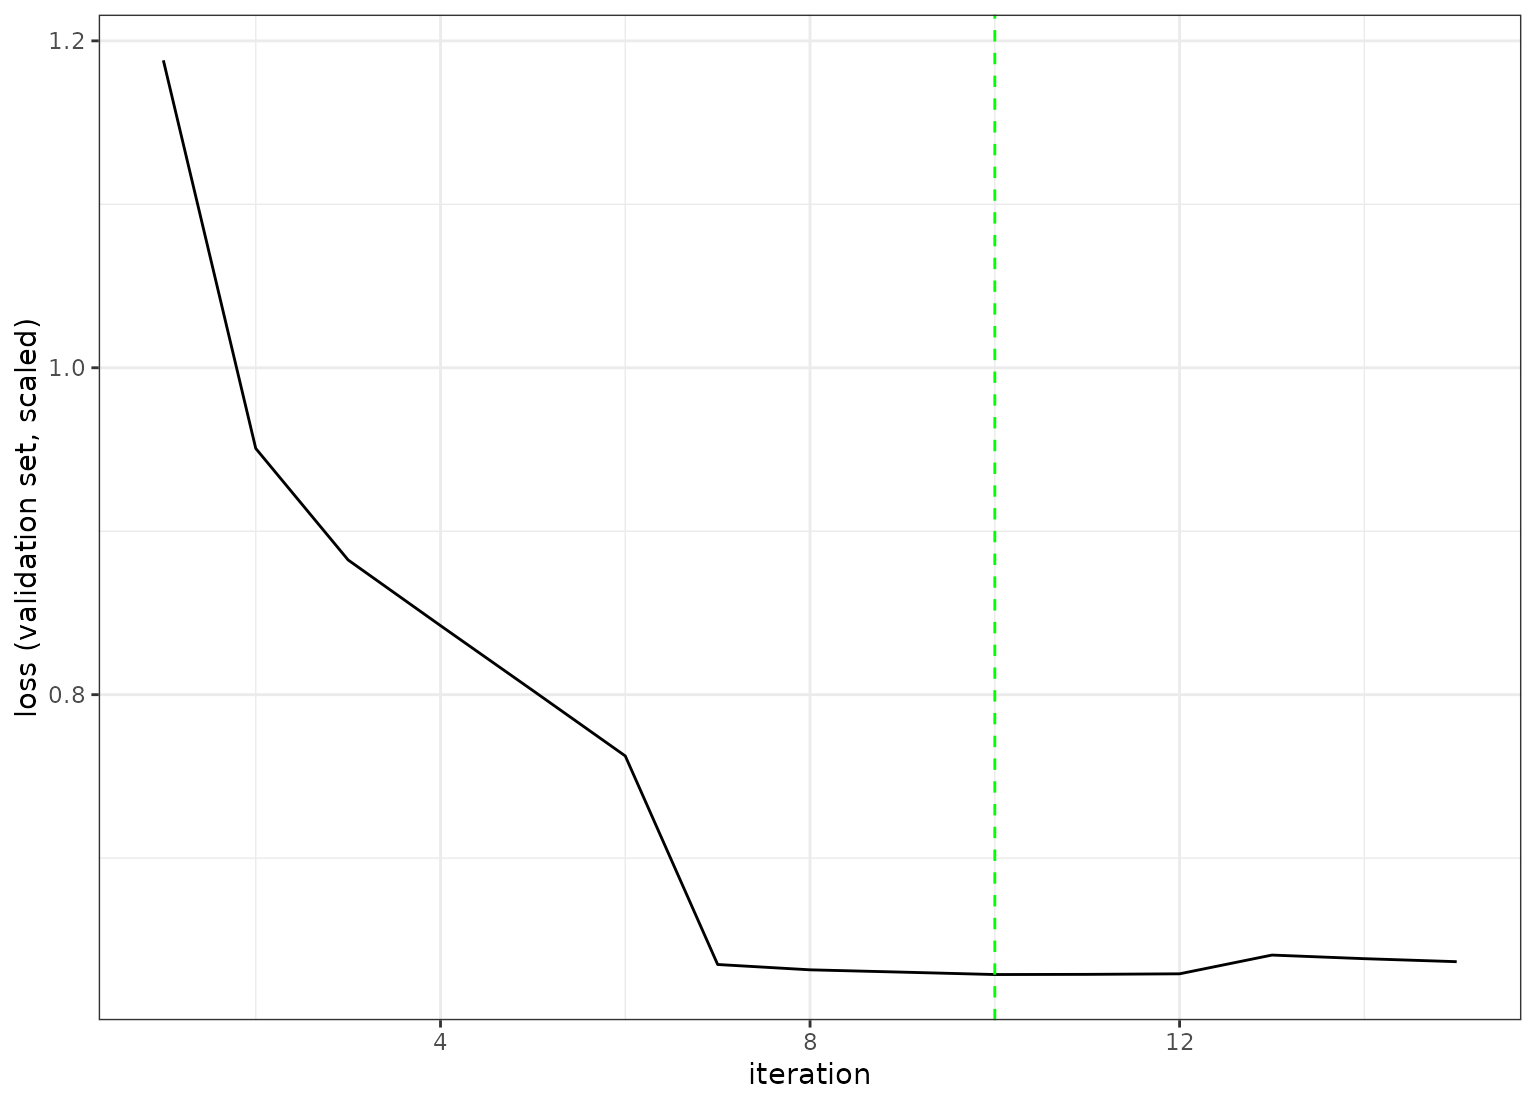
This function plots the loss function across the available epochs. A vertical line shows the epoch with the best loss value.
Examples
# \donttest{
if (torch::torch_is_installed() && rlang::is_installed(c("recipes", "yardstick", "modeldata"))) {
 library(ggplot2)
 library(recipes)
 theme_set(theme_bw())

 data(ames, package = "modeldata")

 ames$Sale_Price <- log10(ames$Sale_Price)

 set.seed(1)
 in_train <- sample(seq_len(nrow(ames)), 2000)
 ames_train <- ames[ in_train,]
 ames_test  <- ames[-in_train,]

 ames_rec <-
  recipe(Sale_Price ~ Longitude + Latitude, data = ames_train) |>
    step_normalize(all_numeric_predictors())

 set.seed(2)
 fit <- brulee_mlp(ames_rec, data = ames_train, epochs = 50, batch_size = 32)

 autoplot(fit)
}
#> Loading required package: dplyr
#>
#> Attaching package: ‘dplyr’
#> The following objects are masked from ‘package:stats’:
#>
#>     filter, lag
#> The following objects are masked from ‘package:base’:
#>
#>     intersect, setdiff, setequal, union
#>
#> Attaching package: ‘recipes’
#> The following object is masked from ‘package:stats’:
#>
#>     step

# }
# }